In today's DevOps ecosystem, Elasticsearch cluster is widely used for enabling centralized logging and observability apart from its routine search functionality.
In this post, we'll be working on setting up a production-grade Elasticsearch cluster on AWS along with its necessary addons like Kibana, enable snapshots on S3 bucket, fine tuning server parameters, optimizations and monitoring using Promtheus and Grafana. We'll be using Ansible to automate majority of this setup process. This complete setup will take us 6-8 hours to get the cluster up and running.

Prerequisites #
Create 1 EC2 Key-pair and use the same for all the servers created for this setup.
Preferably, all EC2 instances for this setup should be created in same availability zone to reduce latencies and data transfer costs.
- Access to AWS (else your Cloud Provider) Account with permissions to create+update EC2, ALB, ACM, IAM, S3, Route53 resources
- 3 r5a.large Ubuntu 18.04 Servers with 50 GB primary and 1 TB secondary EBS volume for Elasticsearch Data nodes
- 3 t3a.small Ubuntu 18.04 Servers with 50 GB EBS volume for Elasticsearch Master nodes
- 1 t3a.large Ubuntu 18.04 Server with 50 GB EBS volume for Kibana
- Existing Prometheus setup
- Existing Grafana setup with Prometheus configured as a data source
- 1 S3 bucket, we will call this bucket as
es-snapshotin this post - A jump server with Ansible installed having ssh access to the above EC2 machines
Get the above ready before we start the setup. Ensure the network policies (Security-groups) are properly whitelisting relevant ports and source IP addresses. You may change the instance types as per your requirements, but the above are minimum requirements for a stable cluster.
Initiate Setup #
The complete installation comprises of 7 major steps. Before start with next step, it is recommended to verify the previous step thoroughly.
Step 1 - Configure Servers #
The servers participating in the cluster will have humongous inter data transfer and we'll use a host name to access these servers. To reduce the DNS latency, we'll make an entry in the /etc/hosts file in each of these servers.
Edit the /etc/hosts file using vim and append the following lines. Make sure you update the IP addresses of these servers according to your setup. Update this in Ansible jump server, all data nodes, master nodes and Kibana server.
10.1.1.11   master01
10.1.1.12   master02
10.1.1.13   master03
10.1.1.21   node01
10.1.1.22   node02
10.1.1.23   node03
Create a S3 bucket as es-snapshot (choose any available name). Create a IAM role as ec2-role-elasticsearch and add the following JSON policy. Update the bucket name in this policy.
{
    "Version": "2012-10-17",
    "Statement": [
        {
            "Sid": "ListOperations",
            "Effect": "Allow",
            "Action": [
                "s3:ListBucketMultipartUploads",
                "s3:ListBucketVersions",
                "s3:ListBucket",
                "s3:GetBucketLocation"
            ],
            "Resource": "arn:aws:s3:::es-snapshot"
        },
        {
            "Sid": "GetPutOperations",
            "Effect": "Allow",
            "Action": [
                "s3:PutEncryptionConfiguration",
                "s3:PutObject",
                "s3:GetObject",
                "s3:GetEncryptionConfiguration",
                "s3:AbortMultipartUpload",
                "s3:DeleteObject",
                "s3:ListMultipartUploadParts"
            ],
            "Resource": "arn:aws:s3:::es-snapshot/*"
        }
    ]
}
Attach the ec2-role-elasticsearch role to these 3 data nodes, 3 master nodes and Kibana node.
Let us format the secondary EBS volumes to xfs filesystem on data nodes and mount them. Refer to this documentation from AWS to format and mount these volumes on data nodes.
Make sure you mount these volumes to /opt/elasticsearch location. Update the /etc/fstab entry as well to use this location. For verification purpose, reboot all these servers after this step and check the mounted locations using df -lh command.
Step 2 - Install Elasticsearch using Ansible #
Login to the Jump server, all the commands in this step should be executed on the Jump server.
Download the official Elasticsearch role from Ansible Galaxy using the following command. You may select appropriate elasticsearch version. In this post, we are installing version 7.10.1 of Elasticsearch.
ansible-galaxy install elastic.elasticsearch,7.10.1Install the following packages as they are required for the Ansible playbook execution
sudo apt install -y python3-pip
pip3 install boto
Now create a new folder called elasticsearch and in that folder let's create the Ansible Playbook files required for installation. Firstly, let us create hosts file
mkdir ~/elasticsearch
cd ~/elasticserch
touch hosts
Now open this hosts file using vim or your choice of text editor and past the following content. Please ensure you update the IP address as per your EC2 instance
[master_node]
10.1.1.11 node_name=master01 ansible_user=ubuntu
10.1.1.12 node_name=master02 ansible_user=ubuntu
10.1.1.13 node_name=master03 ansible_user=ubuntu
[data_node]
10.1.1.21 node_name=node01 ansible_user=ubuntu
10.1.1.22 node_name=node02 ansible_user=ubuntu
10.1.1.23 node_name=node03 ansible_user=ubuntu
Now create the playbook.yml which will be used to execution installation in our servers,
touch playbook.ymlEdit this playbook.yml, past the following yaml content and save it. You may update the cluster name to your desired value.
- hosts: master_node
  roles:
    - role: elastic.elasticsearch
  vars:
    es_data_dirs:
      - "/opt/elasticsearch"
    es_log_dir: "/var/log/elasticsearch"
    es_heap_size: "1g"
    es_config:
      cluster.name: "es-prod"
      cluster.initial_master_nodes: ["master01", "master02", "master03"]
      discovery.seed_hosts: ["master01", "master02", "master03"]
      network.host: "0.0.0.0"
      http.port: 9200
      node.name: "{{ node_name }}"
      node.data: false
      node.master: true
      bootstrap.memory_lock: false
      indices.query.bool.max_clause_count: 10240
    es_plugins:
      - plugin: repository-s3

- hosts: data_node
  roles:
    - role: elastic.elasticsearch
  vars:
    es_data_dirs:
      - "/opt/elasticsearch"
    es_log_dir: "/var/log/elasticsearch"
    es_heap_size: "6g"
    es_config:
      cluster.name: "es-prod"
      cluster.initial_master_nodes: ["master01", "master02", "master03"]
      discovery.seed_hosts: ["master01", "master02", "master03"]
      network.host: "0.0.0.0"
      http.port: 9200
      node.name: "{{ node_name }}"
      node.data: true
      node.master: false
      bootstrap.memory_lock: false
      indices.query.bool.max_clause_count: 10240
      thread_pool:
        write:
            size: 5
            queue_size: 50000
    es_plugins:
      - plugin: repository-s3
Finally, let's execute this playbook. Execute the following command
ansible-playbook -i hosts playbook.ymlIn case you see any error on execution, refer to this Official Github repository and look for reported issues to find solution. This should ideally execute successfully.
Cluster is ready! Let us verify if this cluster is working fine. Execute the following command to check the health of our cluster.
curl http://master01:9200/_cluster/health?prettyThe output of this should be as following,
{
  "cluster_name" : "es-prod",
  "status" : "green",
  "timed_out" : false,
  "number_of_nodes" : 6,
  "number_of_data_nodes" : 3,
  "active_primary_shards" : 98,
  "active_shards" : 190,
  "relocating_shards" : 0,
  "initializing_shards" : 0,
  "unassigned_shards" : 0,
  "delayed_unassigned_shards" : 0,
  "number_of_pending_tasks" : 0,
  "number_of_in_flight_fetch" : 0,
  "task_max_waiting_in_queue_millis" : 0,
  "active_shards_percent_as_number" : 100.0
}
Note the green status of the cluster, this confirms that the cluster is healthy. Also confirm the number of nodes as 6 (master+data) and number of data nodes as 3. This ensures that all the nodes are actively participating in our cluster.
Step 3 - Install Kibana #
Login to Kibana server and execute the following commands to install latest Kibana
wget -qO - https://artifacts.elastic.co/GPG-KEY-elasticsearch | sudo apt-key add -
sudo apt install -y apt-transport-https
echo "deb https://artifacts.elastic.co/packages/7.x/apt stable main" | sudo tee -a /etc/apt/sources.list.d/elastic-7.x.list

sudo apt update
sudo apt install -y kibana
On success, let's update the Kibana config values in /etc/kibana/kibana.yml as following
server.host: 0.0.0.0server.name: kibana.yourdomain.comelasticsearch.hosts: ["http://node01:9200","http://node02:9200","http://node03:9200"]Enable and restart Kibana service now
sudo systemctl enable kibana
sudo systemctl restart kibana
Let us expose Kibana via an AWS Application Load Balancer. You should have an exisitng certificate via ACM for *.yourdomain.com associated existing or new ALB. Create a target group for Kibana, select port as 5601 and register Kibana instance with it. In the ALB, configure rule in HTTPS listener for kibana.yourdomain.com to forward to this target group. Ensure that the security group attached to Kibana instance allows all traffic from the ALB's subnet to port 5601.
Now navigate to kibana.yourdomain.com in your web browser, this should load the Kibana interface.

Note that Kibana does not support authentication in open source edition, hence you may want to expose it only to known IP addresses or VPN endpoints via the ALB.
Step 4 - Configure S3 Repository #
Open Kibana in your web browser and navigate to Stack Management section. Select Snapshot and Restore and click on the Repositories tab on this page. Click on Register a repository, you should see an option for AWS S3 as a Repository type. Enter name of the repository as es-snapshot and select AWS S3 type of repository. On next page, leave the client name empty.
- Enter the bucket name as
es-snapshot - Enter the base path as
prod - Enable Snapshot compression
- Enable Server-side encryption
Register this repository. If there are any errors, please check your cluster logs for details. This could ideally be if the s3 repository plugin version is not same across nodes, IAM role doesn't have appropriate permission or the role is not attached to the EC2 instances.
On configuring this repository, you can now enable snapshots of your selected indices and verify the same,
Step 5 - Exporter for Prometheus #
Now that we have our cluster configured and Kibana setup to access the data, in this step we will work on setting up monitoring for our cluster to get better metrics. We will use Elasticsearch Exporter for Prometheus for this. We will be running this exporter using container on the Kibana instance.
Login to Kibana instance. Refer to this documentation to install Docker and Docker-cli in this instance. Once installed, execute the following commands to start the exporter service.
docker pull justwatch/elasticsearch_exporter:1.1.0
docker run --rm -d -p 9114:9114 --name elasticsearch_exporter justwatch/elasticsearch_exporter:1.1.0 '--es.uri=http://node01:9200'
Refer to this Github repository for more details on the Elasticsearch Exporter for Prometheus
Login to your Prometheus instance, edit its config in location /etc/prometheus/prometheus.yml and append the following block to scrape for our new exporter
  - job_name: 'es-prod'
    scrape_interval: 1m
    static_configs:
    - targets: ['elastic-exporter-ip-address:9114']
      labels:
        cluster: 'es-prod'
Step 6 - Grafana Monitoring #
As per prerequite of this post, we consider that your Grafana already has the above Prometheus instance added as a data source. Let us use this data source to plot our Elasticsearch cluster metrics on a dashboard. Import this dashboard in Grafana.
Finally, the dashboard should show the graphs and metrics like the screenshot below.
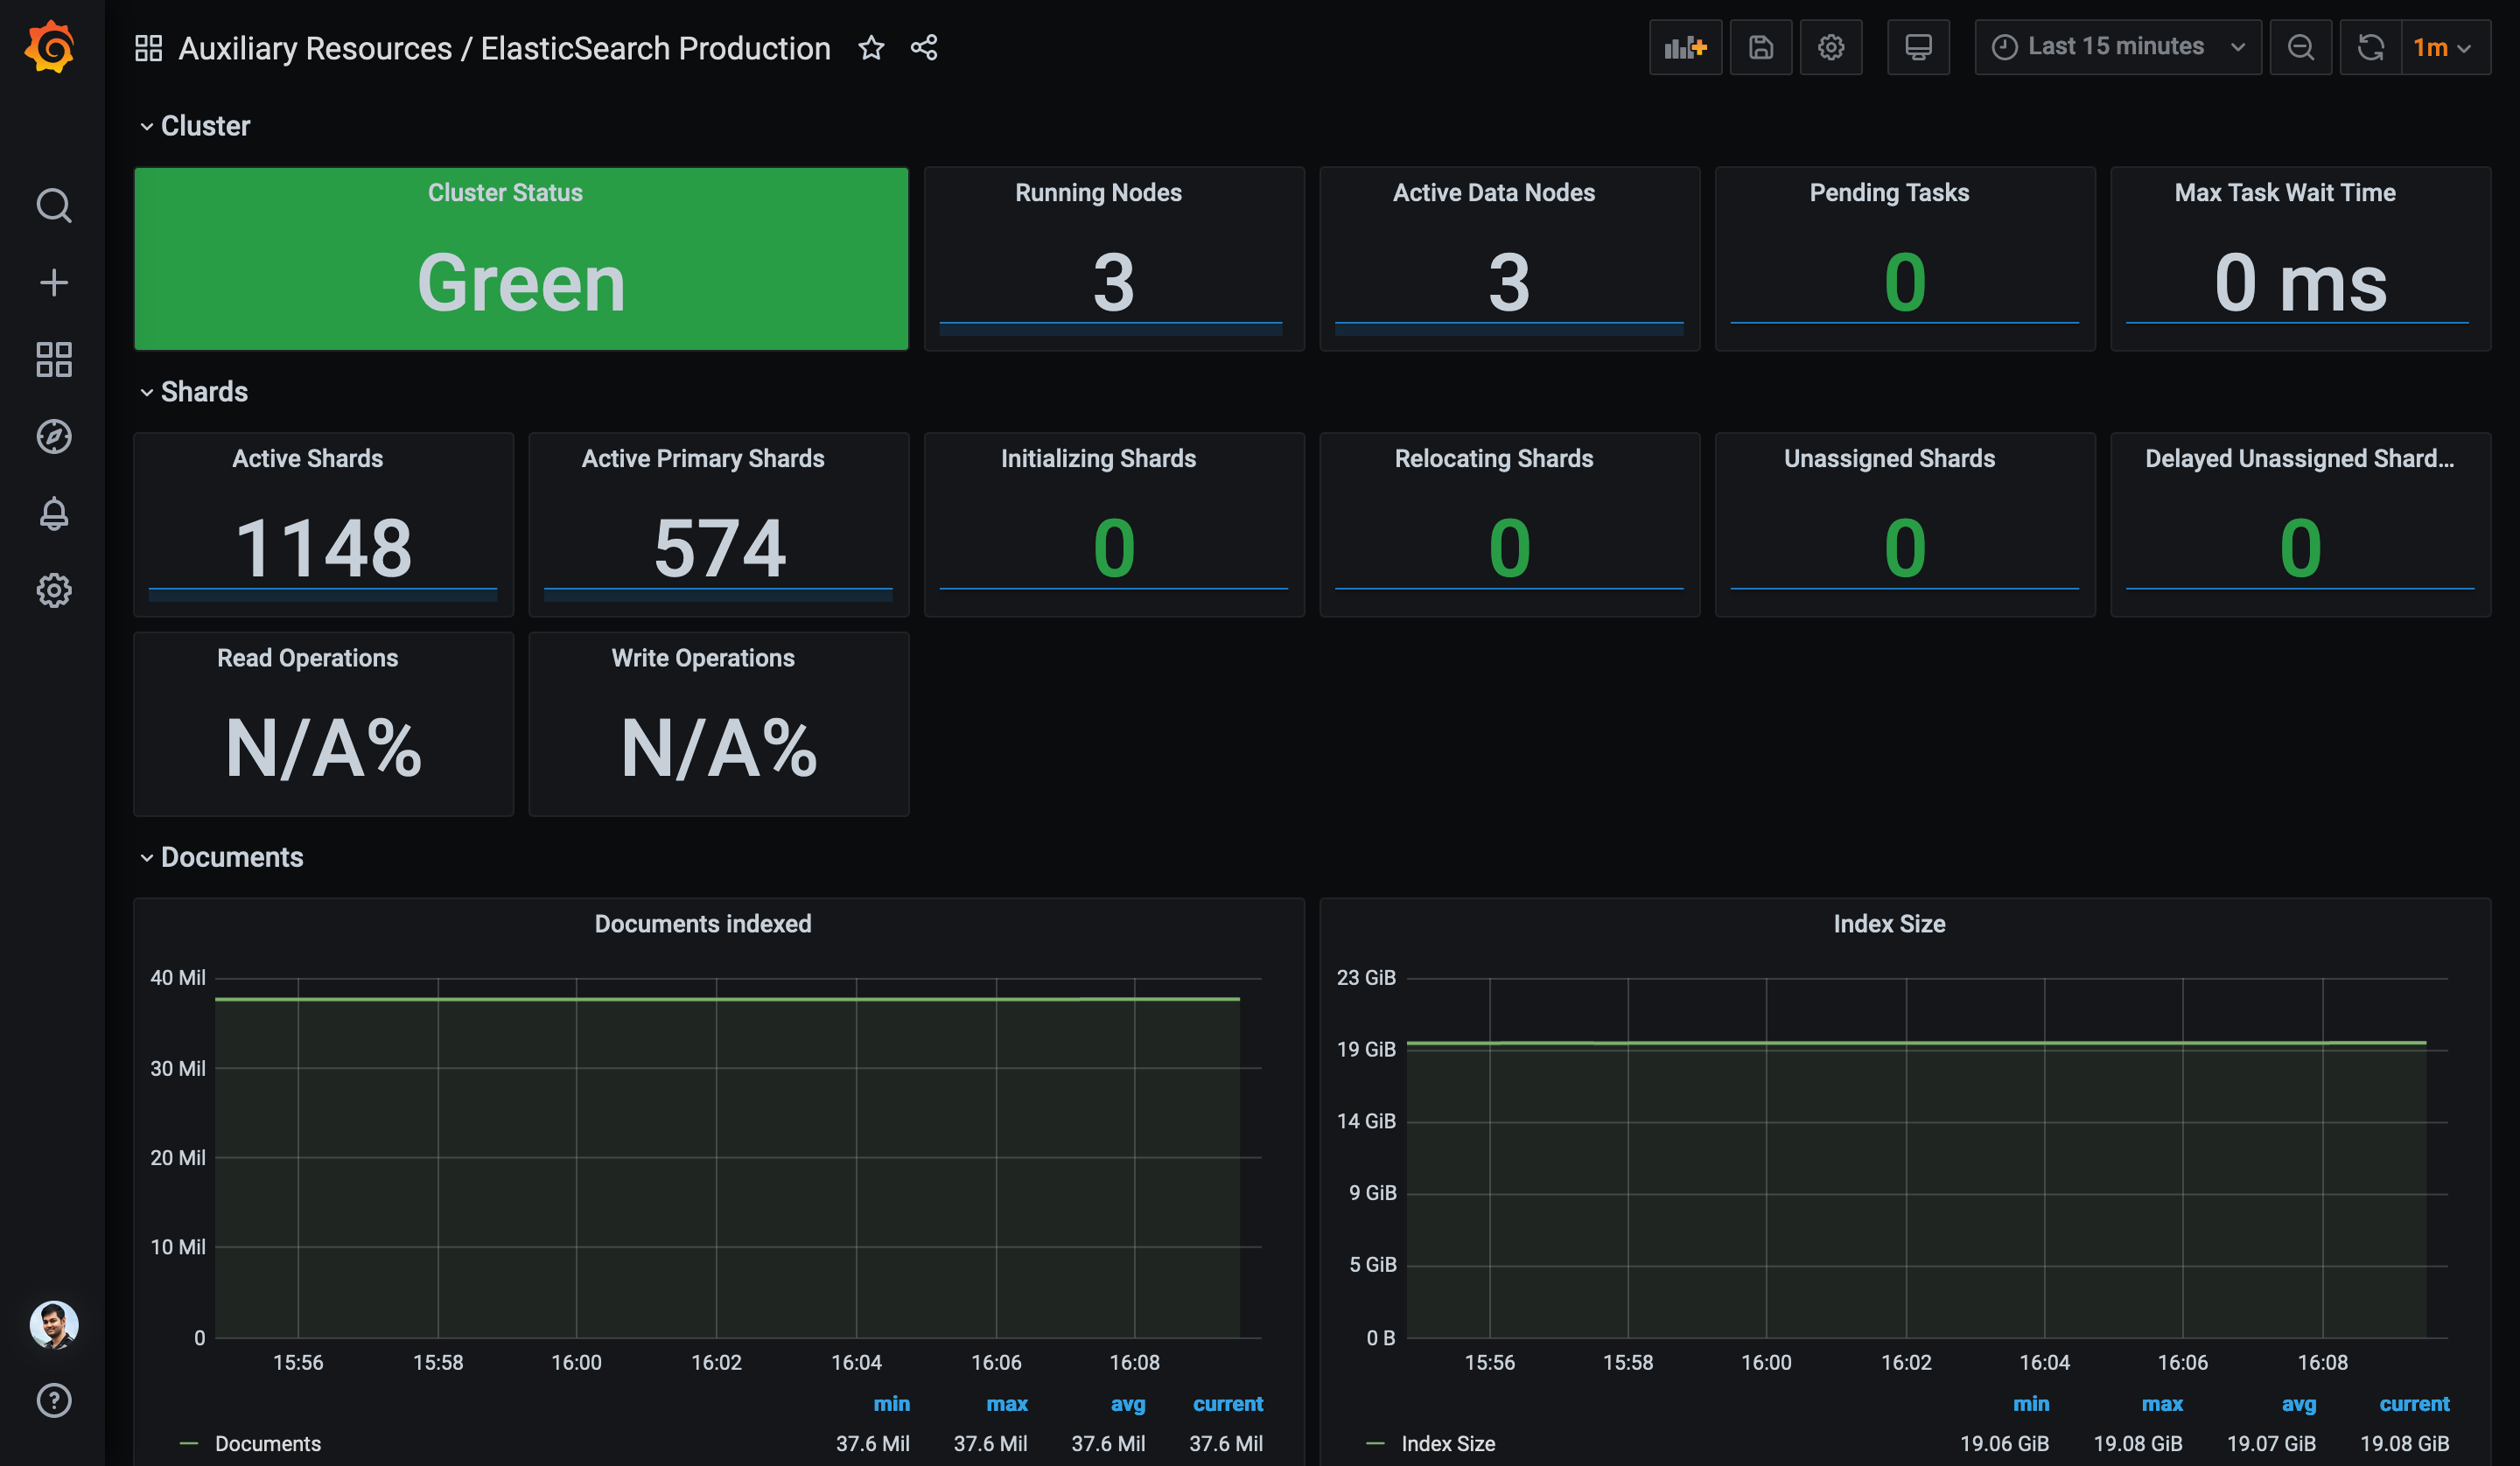
Verify all metrics are populated and reflecting fine in this dashboard. Please leave a comment here with your feedback.
Next Steps #
On completion of the above steps, you should have a working healthy cluster with monitoring and backup enabled. You may now install various Beat agents in your applications hosts and connect to Elasticsearch Data nodes. Ensure that your Data nodes allow connection to port 9200 via Security Groups.
You can follow the official guide to enable security for your cluster.
You can install metricbeat for Elasticsearch stack monitoring.
Conclusion #
Congratulations, you've got yourself a shiny new Elasticsearch cluster with optimal configurations and state of the art monitoring. You should now keep monitoring your cluster for initial few days to understand the performance metrics and upgrade your cluster instance type as per requirement. It is highly recommended you read up on how to perform zero-downtim upgrades on this cluster, execute administration using Dev tools and other maintenance activities.
Related Links #
- How to perform a zero-downtime upgrade of Elasticsearch in production
- Benchmarking and sizing your Elasticsearch cluster for logs and metrics
- Save space and money with improved storage efficiency in Elasticsearch 7.10
- What's new in 7.10
If you like this post you can share it on your favorite social media network.
For feedback, please ping me on Twitter.
Published